Hearing tests may provide information about your auditory health. And it is represented with the help of an Audiogram. However, understanding the meaning of all the symbols and numbers on an audiogram feels like cracking a cryptic code. Thus, being able to understand an audiogram is essential to learning about the condition of your auditory health.
Audiogram
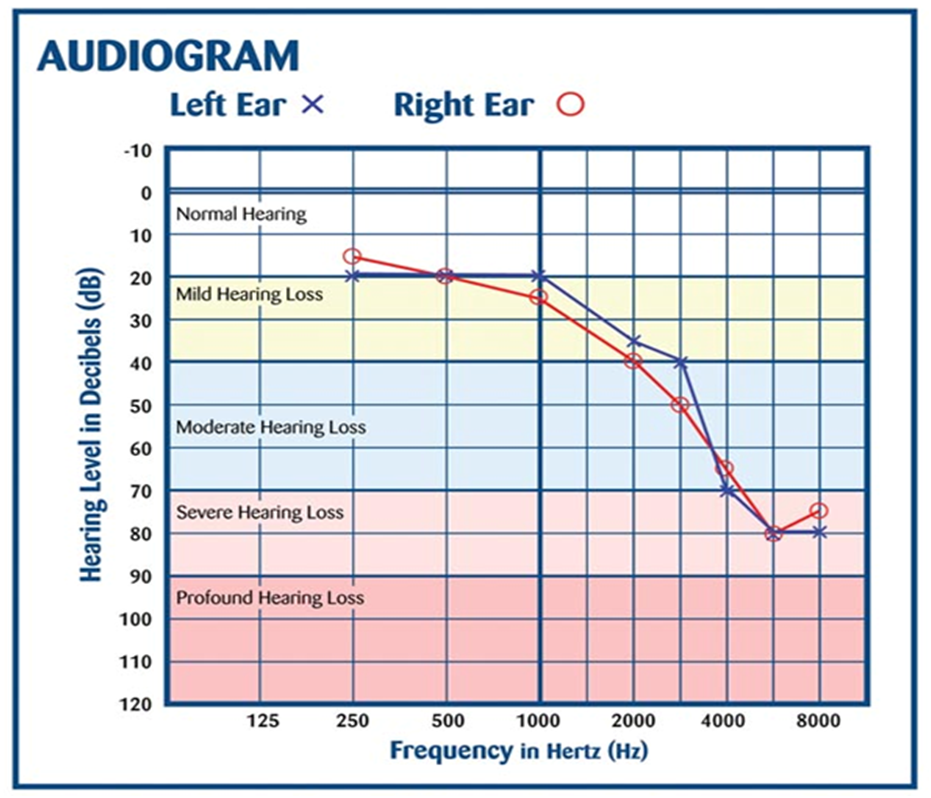
An audiogram is similar to a regular graph. It’s a graph-based, detailed visual representation of your hearing abilities. It graphically illustrates your hearing ability and the possibility of hearing loss by showing your hearing sensitivity across various sound intensity levels (loudness) and frequencies (pitches).
The audiogram is in the opposite direction with louder dB sounds at the bottom and softer dB sounds at the top. During the hearing test, various sound intensity levels at particular frequencies are tested to evaluate the general health of your hearing, on the Y-axis. Higher markers mean better hearing ability and the ability to hear quieter sounds.
How to Understand an Audiogram
In an audiogram,
- The X-axis (horizontal) is used to display sound frequency.
- The usual frequency range of sounds is between 250 Hz (low-pitched sounds) and 8000 Hz (high-pitched sounds).
- Sound frequency is the rate at which a sound wave vibrates. and which is directly linked to our sensation of sound pitch.
- The vibrations of low-frequency sounds, like a bass drum, are slower than those of high-frequency noises like birds tweeting.
- The Y-axis (vertical) represents sound intensity levels.
- Sound intensity illustrates how a sound is loud, and is measured in decibels (dB).
- The frequency range is -10 dB HL (delicate sounds, like a whisper) to 120 dB HL (very loud sounds, like a music performance).
Symbols on Audiograms
On an audiogram, Hearing thresholds, or the decibel (dB) levels at which such quiet sounds become clear to you, are represented as symbols and plotted at particular places.These symbols are frequently represented as specific colors as well help you further distinguish the results of your left ear from your right ear:
- The right ear is typically marked with Red audiogram symbols.
- The left ear often gets marked with Blue audiogram symbols.
Symbols that appear most frequently on an audiogram graph are:
| SYMBOL | MEANING |
| O | Your right ear’s unmasked air conduction thresholds |
| X | Your left ear’s unmasked air conduction thresholds |
| Δ | Your right ear’s masked air conduction thresholds |
| [] | Your left ear’s masked air conduction thresholds |
| < | Your right ear’s unmasked bone conduction thresholds |
| > | Your left ear’s unmasked bone conduction thresholds |
| [ | Your right ear’s masked bone conduction thresholds |
| ] | Your left ear’s masked bone conduction thresholds |
Hearing Threshold
The hearing threshold represents the quietest noise audible at various frequencies. It means it indicates the lowest sound intensity required for you to perceive a particular sound frequency. And it is expressed in decibels (dB).
To determine your hearing thresholds, A hearing specialist utilizes two key tests:
- Air Conduction
The ability to detect sounds as they travel through the air, which is how most of us normally hear sounds, is known as your air conduction threshold.
A hearing specialist will play sounds through headphones at different frequencies and loudness during an air conduction test, and you will be asked to identify when you can hear them.
- Bone Conduction.
Bone conduction testing determines how sensitive your inner ear is as well as how well your auditory nerve functions.
In this section of the test, the hearing care professional will use an oscillator, a bone conduction device, to send mild vibrations as a form of sound waves directly to your auditory nerve.
Your bone conduction thresholds, which avoid the outer and middle ear, will help identify the kind of hearing loss you have, which may include:
• Sensorineural Hearing Loss: caused by problems with the auditory nerve or inner ear.
• Conductive hearing Loss: caused by issues with the middle or outer ear.
• Mixed Hearing Loss: A mix of the above two.
How to Understand It?
- According to the audiogram, your hearing falls into one of the following categories: normal (-10–20), mild (25–40), moderate (40–55), moderately severe (55–70), severe (70–90) and profound (90–110).
- The findings of air conduction are measured using headphones or implanted earphones.
- On the graph, the left ear is represented by X symbols, while O symbols represent the right ear. The other symbols on the graph, which resemble brackets, represent the sounds that the inner ear receives through bone conduction.
- A unique headband is used to measure the results of bone conduction. For example, middle ear growth (otosclerosis), moisture in the ear, or other causes. We refer to this as mixed or conductive hearing loss.